
Introduction
Your boss has given you a task that involves the compilation of large data sets and converting them into a simpler and comprehensible form. What would you do? Compiling large data sets is very challenging as it involves hours of manual work and a thorough in-depth study of the data to compile and build a comprehensive report. If this is done manually, it could take several months and many resources will also be involved in this task. Another pressing concern is that there is also a lot of room for human error in the entire process. This daunting task can be completed with ease through the process of data visualization. Read on to know more.
What is Data Visualization?
Data visualization has the ability to translate complex data sets into visual formats that can be easily understood. The main objective is to ensure easy access to data and empower users to identify trends, patterns, and outliers quickly and efficiently. It makes your work a breeze as it enables you to process large data and break them down into simpler visual formats that are easier to understand. This data is represented as charts or graphs to support better understanding. There are different types and techniques involved in data visualization.
Types of Data Visualization
Data can be processed, sorted, and visualized in different ways. You can use generative AI and machine learning techniques to aid in processing and sorting voluminous data. Data can be organized in either a numerical way or a categorical way. In numerical data visualization, the age distribution of a certain group of people can be visualized using a pie chart or a bar graph. In categorical data visualization, the demographics of certain groups can be classified and categorized in the form of a bar graph or pie chart. These techniques give you a clear-cut picture of data, which is presented in a pictorial format. It helps data scientists to derive actionable insights and make decisions in a more informed manner.
Data Visualization Techniques
Before understanding different data visualization techniques, you need to have a clear picture of your audience, know who will be viewing your data, and frame your output according to their needs and expertise. Pay attention to the more critical aspects of your data and present it in a simple manner, it should neither be too complicated nor too fancy. Select a chart type that best fits your data set and communicates the message in a crisp manner. Do not forget to double-check the data to ensure that the representations are done correctly. There should be no room for any misrepresentations or inaccuracies. Arrange all the elements logically so that they can guide viewers appropriately and support interpretation. Make your representations accessible to all audiences by considering factors like color blindness, screen reader compatibility, and font size. Ensure to refine your visualizations based on feedback and changing trends continuously.
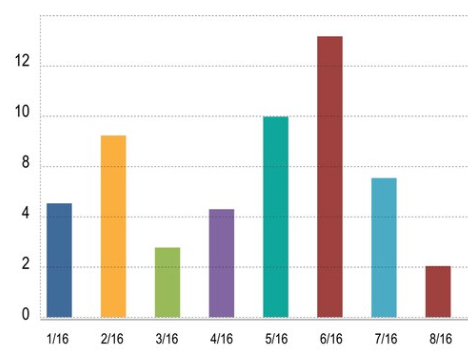
Histogram
A histogram is similar to a bar graph and is used to represent numerical data. Here, the bars are used to show the frequency of data points within specific intervals, enabling you to visualize the frequency distribution of a set of continuous data. A histogram is widely used in displaying the age distribution of a population. They are easy to interpret, enabling viewers to derive a conclusion with ease. Histograms are widely used in the healthcare industry to display patient age distributions, helping in resource planning for different age groups.
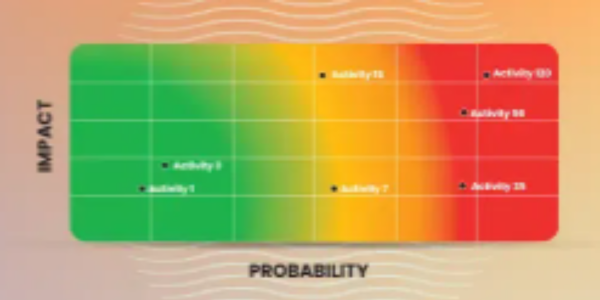
Heatmaps
Heatmaps represent data where individual values contained in a matrix are represented as colors. It is used to display the density or intensity of data points in a two-dimensional space and is applicable for geographic locations or the correlation between variables. It helps in the visual representation of data density and is excellent for showing correlations. For instance, a heatmap can be used on a website to showcase user engagement. However, at times, it could overwhelm the viewer with too much data. Heatmaps are typically used in UI/UX design to analyze customer behaviour on websites and improve the design based on user interaction.
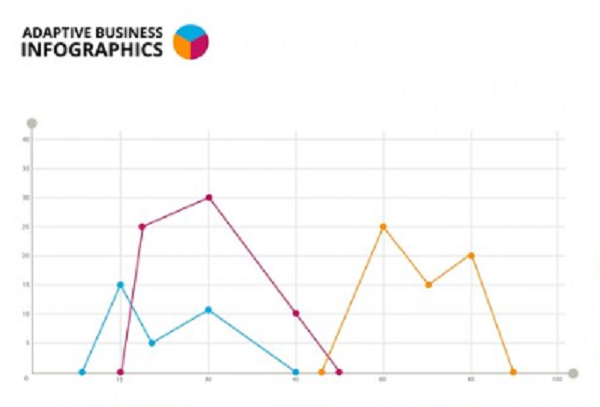
Line Chart
Line Charts are the most widely used data visualization techniques. These charts present data in a graphical manner and can be used to inform users of trends and patterns in a crystal clear manner. These charts showcase scatter plots that depict the relationship between two variables. They are used to show the yearly/monthly profits of individuals over time. Line Charts are widely used in tracking stock prices over a period of time. Corporates use line charts to track financial metrics for better decision-making.
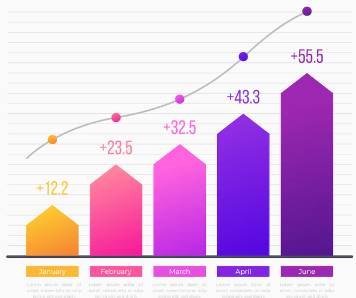
Bar Graph
Also known as a bar chart, a bar graph uses rectangular bars to represent data. It is used to compare two or more categories or groups of data. They are used in various businesses to compare annual sales across different areas. They are simple to use and quite versatile in handling various data types. However, they are not effective for representing larger data sets. The education industry uses bar graphs to compare student performance across different subjects which helps teachers to identify areas for improvement.
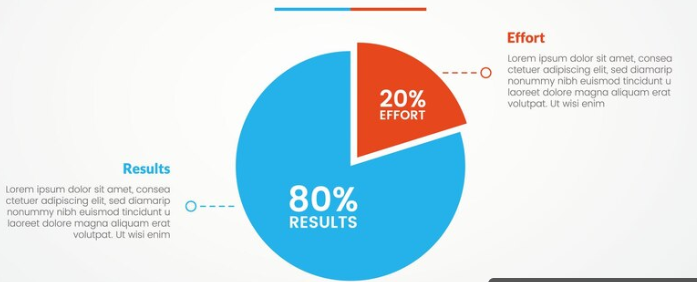
Pie chart
Pie charts are circular statistical graphs that represent data in slices. It is widely used to represent market share distribution and gives you a proportionate understanding of the market. However, they are harder to compare small segments.
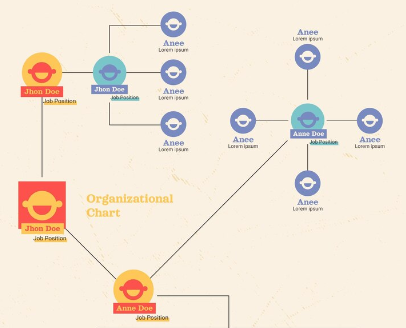
Tree map
A tree map can be used to represent hierarchical data using nested rectangles where each brand of the hierarchy is represented by a colored rectangle with smaller rectangles that represent sub-branches. Here, every rectangle is proportional to the data that it represents. They are used to represent a company’s budget and are good to showcase relationships. However, they can be complex to interpret as they contain too many levels. Treemaps are used in corporate organizations to break down investment portfolios by asset class and give a clear picture of asset distribution.
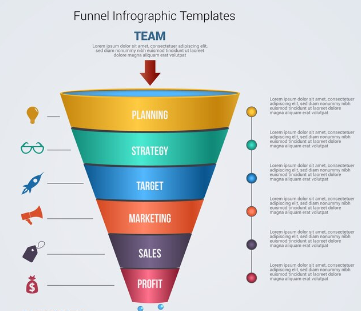
Funnel chart
What would you do if you needed to showcase the process flow and drop off data points through each stage? A funnel chart is the ideal option that will help you represent various stages in a process, this makes it easy to visualize conversion rates and bottlenecks. They are commonly used to depict sales pipeline stages to closed sales. Funnel charts can also be used to track the customer journey from initial contact to purchase which helps marketers to improve their sales strategy. The only downside to a funnel chart is that it is limited to data with clear progression and cannot be used in presenting a complex process.
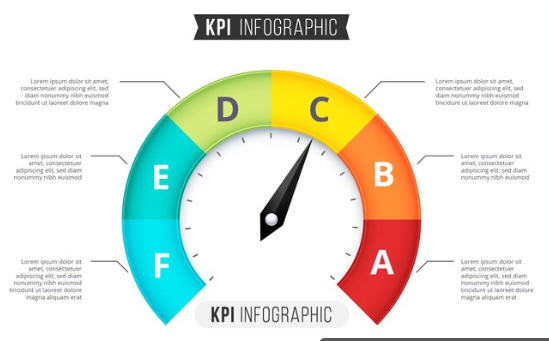
Gauge chart
As the name suggests, a gauge chart is like a speedometer that displays data in a dial format. What would you do if you were given a task to represent a single data point as a progress to a specific goal? If you use a gauge chart, you can measure and visualize performance or progress towards a specific goal. Here, the needle can be used to indicate the current value against a predefined threshold. Gauge charts are widely used in human resources to display key performance indicators. They are also used in the manufacturing industry to monitor the performance metrics of machinery to ensure optimum maintenance. The limitation is that they are confined to single data points.
MS Office, Google Analytics, and other similar data visualization tools are widely used in creating these charts. They can also be integrated with generative AI and machine learning algorithms to produce optimal results.
How to Choose the Right Visualization Technique?
Once you have your data sorted, you need to select the right visualization technique to represent the data in a convincing manner. The representation should be such that it helps viewers to get a clear picture and help in influencing their decisions effectively. You can start by analyzing the data type, whether it is numerical, temporal, or categorical. Get a clear understanding of the audience’s goals and visualization and analyze the data volume. If you have a large data set, you need to use histograms. For small datasets scatter plots or line graphs will suffice.
Ensure that the visualization is simple and conveys all the required information. You must never overload the user with too much information as it could obscure the core message. Another quick tip is to use interactive visualizations on digital platforms to enhance user engagement and support deep data exploration. Make sure to use generative AI and machine learning functionalities while compiling data as it will help you achieve data visualization goals faster.
Key Advantages of Data Visualization
Data visualization simplifies large and complex data sets, enhances data interpretation, saves time in analysis, improves communication, and establishes a medium to convey a story through data. Most importantly, it supports faster decision-making and can be used in workshops and training modules to help learners understand concepts faster. Data visualization can help companies to enhance their profit margins and make investment decisions with clear insights.
In today’s competitive market, it is vital to learn data science with generative AI and machine learning. Whether you are a fresher or a working professional, taking up a data science with generative AI course is the need of the hour to stay relevant in the market. Eduinx, a renowned institute in the edutech space, offers a data science with generative AI course that helps you perform advanced data visualization, and leverage generative AI in data analytics applications. They also offer 360-degree career support and help you apply your learnings by performing real-time capstone projects. For more support, you can reach out to Eduinx and get more information on their course.
Reference links:
https://www.geeksforgeeks.org/data-visualization-and-its-importance/ https://vlinkinfo.com/blog/10-data-visualization-techniques-to-derive-business-insights/